

- Topic
62k Popularity
36k Popularity
29k Popularity
16k Popularity
77k Popularity
- Pin
- 🎉 The #CandyDrop Futures Challenge# is live — join now to share a 6 BTC prize pool!
📢 Post your futures trading experience on Gate Square with the event hashtag — $25 × 20 rewards are waiting!
🎁 $500 in futures trial vouchers up for grabs — 20 standout posts will win!
📅 Event Period: August 1, 2025, 15:00 – August 15, 2025, 19:00 (UTC+8)
👉 Event Link: https://www.gate.com/candy-drop/detail/BTC-98
Dare to trade. Dare to win. - 📢 Gate Square Exclusive: #WXTM Creative Contest# Is Now Live!
Celebrate CandyDrop Round 59 featuring MinoTari (WXTM) — compete for a 70,000 WXTM prize pool!
🎯 About MinoTari (WXTM)
Tari is a Rust-based blockchain protocol centered around digital assets.
It empowers creators to build new types of digital experiences and narratives.
With Tari, digitally scarce assets—like collectibles or in-game items—unlock new business opportunities for creators.
🎨 Event Period:
Aug 7, 2025, 09:00 – Aug 12, 2025, 16:00 (UTC)
📌 How to Participate:
Post original content on Gate Square related to WXTM or its
In August, will the upward movement of cryptoassets remain heavy and the adjustment phase continue? | Learn about cryptoassets (virtual coins) like Bitcoin through charts | Moneyクリ Money's investment information and media useful for finances.
August 2025, caution against altcoin pullback
August is known as a summer lull in the stock market, making it a month where it is difficult to actively pursue high prices. Since the FOMC (Federal Open Market Committee) at the end of July 2025, there have been signs of adjustment in the financial markets, and U.S. stocks are also in a downward trend. While agreements on Trump tariffs are being realized among various countries, there is also a time limit for the 90-day extension agreement on U.S.-China tariffs set for August 12. Reports indicate that an extension will be sought again with the approval of President Trump, but will that really happen?
President Trump often turns over tables, so I personally do not think the scenario will unfold as expected. Recently, there were reports suggesting progress in the US-China talks held in Stockholm, but I anticipate that these will serve as small triggers.
Given the current market conditions, the revision of base tariffs amid progressing US-China negotiations poses a risk, and I believe it is more likely that the Trump administration will apply pressure. Therefore, the outcome of the US-China tariff negotiations will be one of the factors influencing market fluctuations, and depending on the content of the discussions, both the stock market and the cryptocurrency market may decline. Additionally, since altcoins particularly rose in July, I expect a correction in August. It seems that a cautious response to potential pullbacks will be the main focus.
Understanding the Pullback of BTC (Bitcoin)
Waiting for the technical buying level at the 16 million yen level.
[Figure 1] BTC/JPY Daily Chart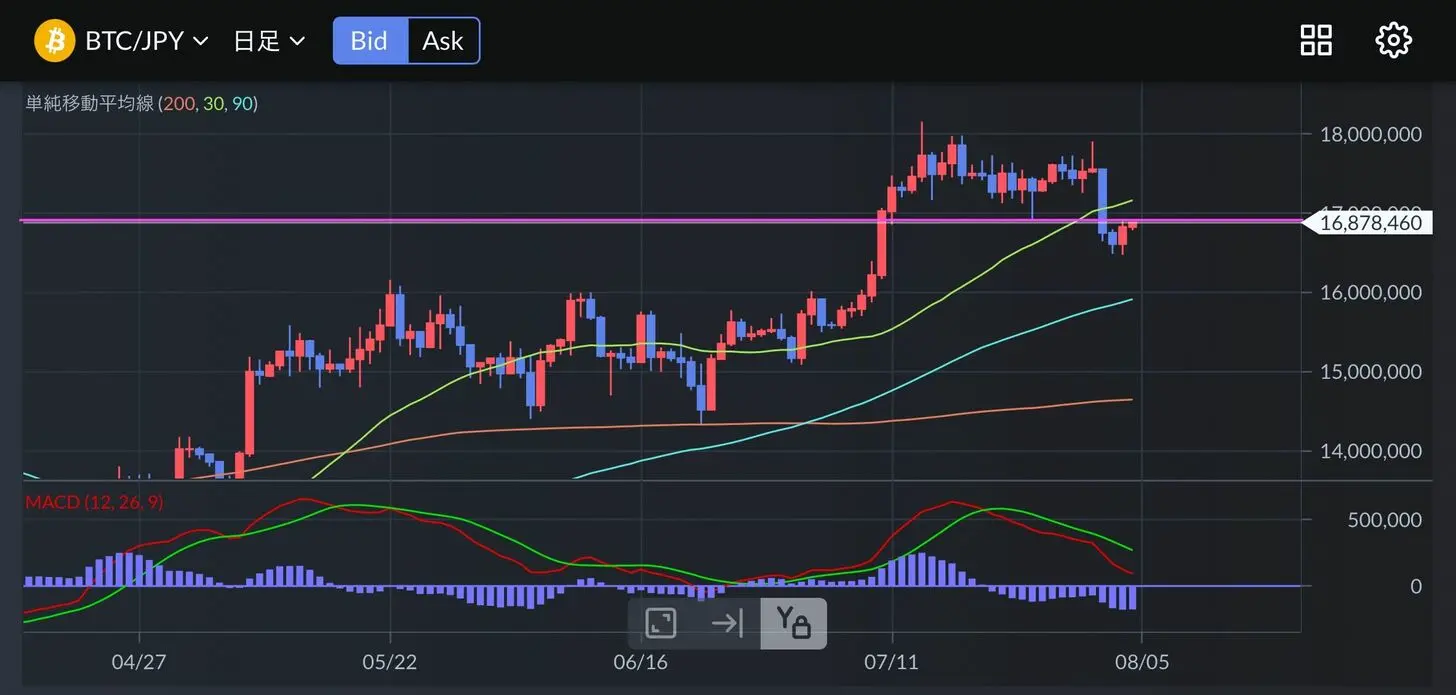 Source: MONEX TRADER CRYPTO (iPhone app)
This is an analysis of the BTC/JPY daily chart. Currently, it is being held down by a resistance line near 16.9 million yen, and whether it can break above this level is the key point. The MACD has formed a clear reversal shape and is currently trending down towards 0.00. I believe that the correction phase will not end unless it declines to this level, so I think waiting for a dip down to around 0.00 before buying on the pullback is a good strategy.
Source: MONEX TRADER CRYPTO (iPhone app)
This is an analysis of the BTC/JPY daily chart. Currently, it is being held down by a resistance line near 16.9 million yen, and whether it can break above this level is the key point. The MACD has formed a clear reversal shape and is currently trending down towards 0.00. I believe that the correction phase will not end unless it declines to this level, so I think waiting for a dip down to around 0.00 before buying on the pullback is a good strategy.
If there are some adjustments, a buy trade just before 16 million yen would be good. This is a cluster point where the support line and SMA90 (light blue) are located if a dip is created within this week. Since it is a price that tends to be a technical buying opportunity, I personally would like to wait for a dip up to this point.
16.9 to 17 million yen is likely to face resistance at higher levels.
[Chart 2] BTC/JPY 4-hour candlestick chart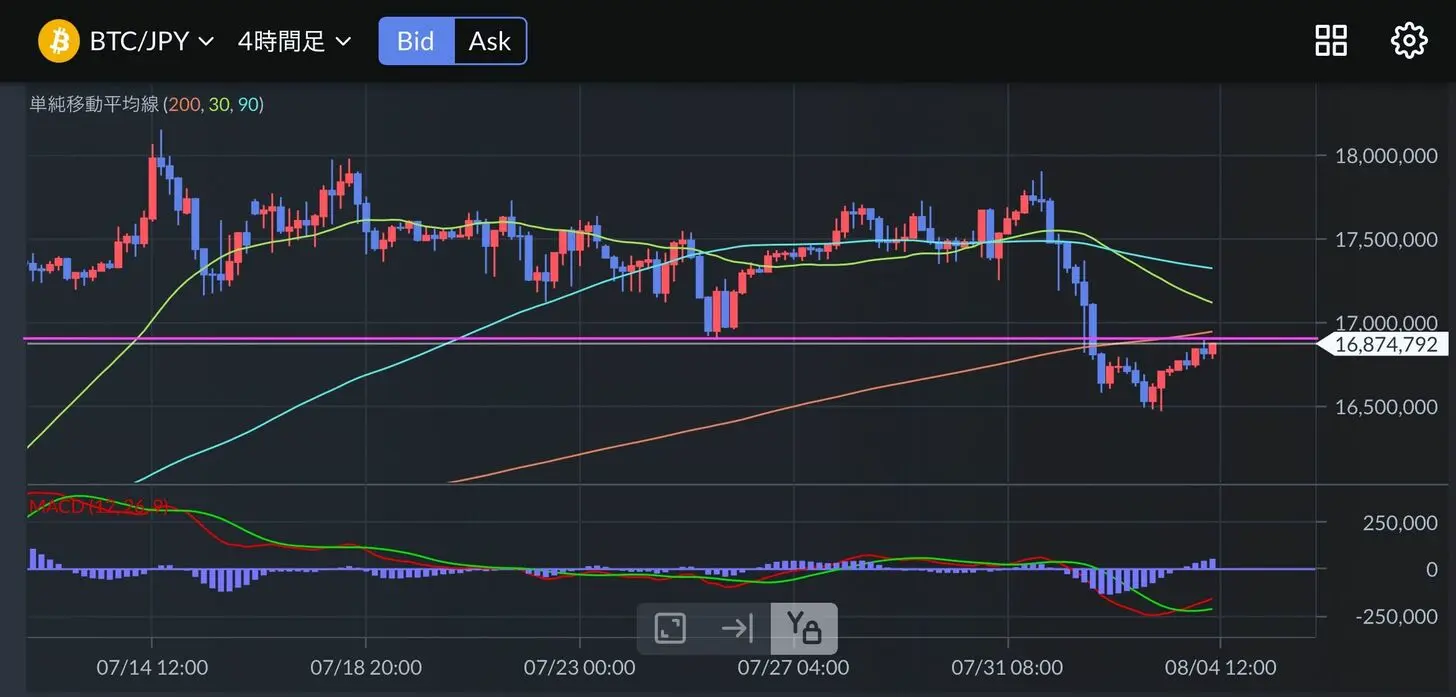 Source: MONEX TRADER CRYPTO (iPhone app)
Switching the time frame for the BTC/JPY 4-hour chart analysis. The price is fluctuating at a level likely to be capped by the SMA200 (orange). Given the presence of a resistance line, this is a technically favorable situation for a short entry.
Source: MONEX TRADER CRYPTO (iPhone app)
Switching the time frame for the BTC/JPY 4-hour chart analysis. The price is fluctuating at a level likely to be capped by the SMA200 (orange). Given the presence of a resistance line, this is a technically favorable situation for a short entry.
If you are aiming for a sell-back, it would be from the current price. Even if it breaks through, the SMA30 and 90 are just above, and there is a possibility of dropping to around 16.9 million yen on August 5th. I believe the upper price will become heavier, so if it stagnates around this area on August 4th, it will likely turn to a decline after August 5th. I think it is better to refrain from buying trades and adopt a strategy of waiting for dips.
Waiting for a deep pullback, the MACD of ETH (Ethereum) is experiencing divergence
[Figure 3] ETH/JPY Daily Chart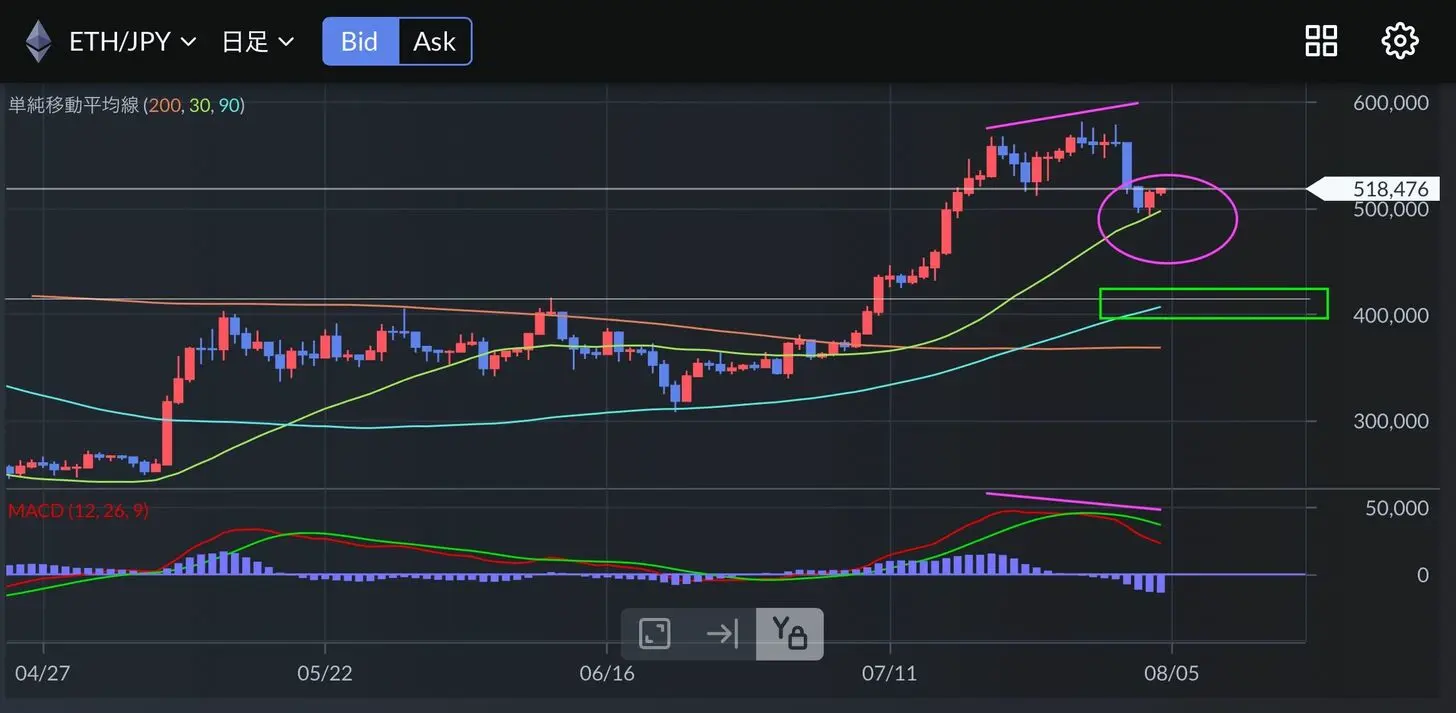 Source: MONEX TRADER CRYPTO (iPhone app)
This is an analysis of the ETH/JPY daily chart. On August 3rd, it was supported by the SMA30 and rebounded, but currently, it is approaching the level of the resistance line. Similar to BTC, it may be a difficult phase for a breakout. The MACD is showing divergence, and it might be wise to refrain from shallow dip buying. If you are aiming for a deeper dip, the support line around 400,000 to 420,000 yen would be ideal. Given that the SMA90 (light blue) is also nearby, it could be a buying opportunity from a technical standpoint.
Source: MONEX TRADER CRYPTO (iPhone app)
This is an analysis of the ETH/JPY daily chart. On August 3rd, it was supported by the SMA30 and rebounded, but currently, it is approaching the level of the resistance line. Similar to BTC, it may be a difficult phase for a breakout. The MACD is showing divergence, and it might be wise to refrain from shallow dip buying. If you are aiming for a deeper dip, the support line around 400,000 to 420,000 yen would be ideal. Given that the SMA90 (light blue) is also nearby, it could be a buying opportunity from a technical standpoint.
However, this is still a point that has fallen by 20% from the current price, so it is somewhat of an unlikely price range. If there is a sudden drop like in 2024, it might become a buying opportunity to target dips, but such price movements are not frequent. Therefore, it may be good to keep in mind to consider buying only if there is an unexpected risk-off factor that causes a drop, possibly in August.
However, the MACD divergence is considered to be of high accuracy, so there will likely be a certain degree of downward adjustment. Additionally, after next week (August 11), an opportunity may arise, so it might be good to reduce your positions and aim for a buy on the dip trade once again.